Over the last six months, we have been tracking our website statistics. These stats have provided us with some interesting insight into who is interacting with the site and what content is the most helpful.
Note: The statistics in this post only account for the pages that fall under the ECEE domain. Admission webpages are not included in this report.
Page statistics
228 pages currently make up the ECEE website
- 142 content pages
- 87 faculty/staff pages
The top 10 according to our visitors
- ECEE – Homepage
- Electrical Engineering MS/MSE
- Course Prerequisites and Topics
- In memoriam – Nongjian “NJ” Tao
- Course syllabi
- NAPS 2020
- NAPS – Call for papers
- Research –
- Electronic and mixed signal circuit design – Research Area
- Electric power and energy systems – research area
- Daniel Bliss
- Junseok Chae
- Nongjian Tao
- John Brunhaver
- Yoon Hwa
- Bertan Bakkaloglu
- Yu Yao
- Vijay Vittal
- Steven Millman
- Jennie Si
- naps 2020
- asu electrical engineering
- junseok chae
- arizona state university electrical engineering
- nongjian tao
- asu ecee
- asu ece
- asu ee
- ecee asu
- electrical engineering asu
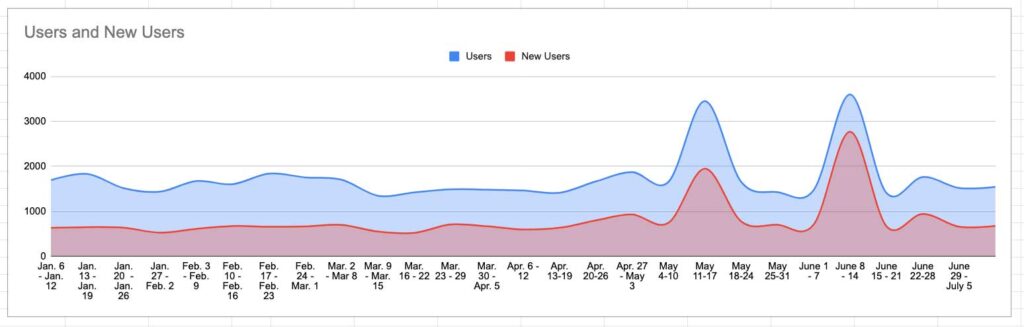
Visitor statistics
Since January, the ECEE website has had 46,708 users, 21,723 (47%) of them are unique visitors. These visitors have viewed pages within the ECEE domain 79,492 times.
Locations
International traffic accounts for 30% of visits
- India
- China
- Canada
- South Korea
- Iran
Top 5 states outside of Arizona
On average, 55% of our domestic traffic is from out of state. This shifted to 70% after we went remote.
- California
- Texas
- Florida
- Virginia
- New York
Top 5 cities
Since going remote.
- Tempe
- Phoenix
- Chandler
- Mesa
- Bengaluru
General user data
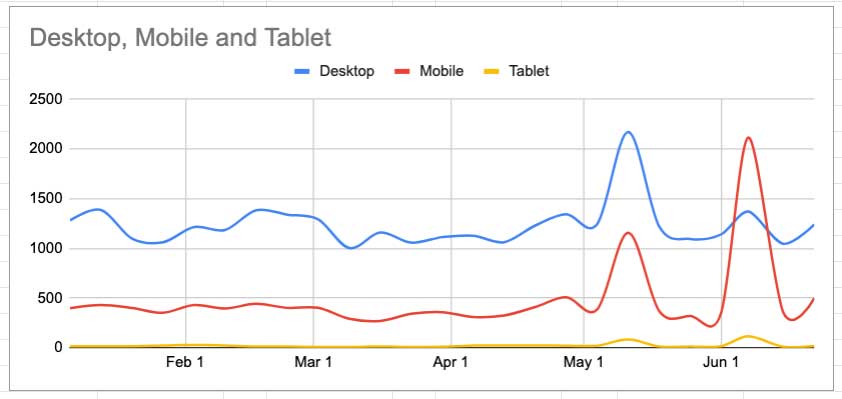
Screens
- 71% of visitors view our site on a desktop
- 28% view our site on a mobile device (Well below the 60% national average)
- 1% view the ECEE site on a tablet
How do they reach our site?
- Search – 69%
- Direct (they know the URL) – 17%
- Referral from another site – 10%
- Email – 2%
- Social – 2%
- Other – 1%
Keeping an eye on this data and talking to our faculty, staff and students will help us make the ECEE website a user-friendly experience for all.